
[social_warfare]
[social_warfare]
In the US, 70% of substance abusers have full-time jobs, 65.7% of adult drug users are employed, and 15% of workers are occasionally drunk at work. Substance abuse leads to 60% of all poor performances and 40% of all industrial accidents.
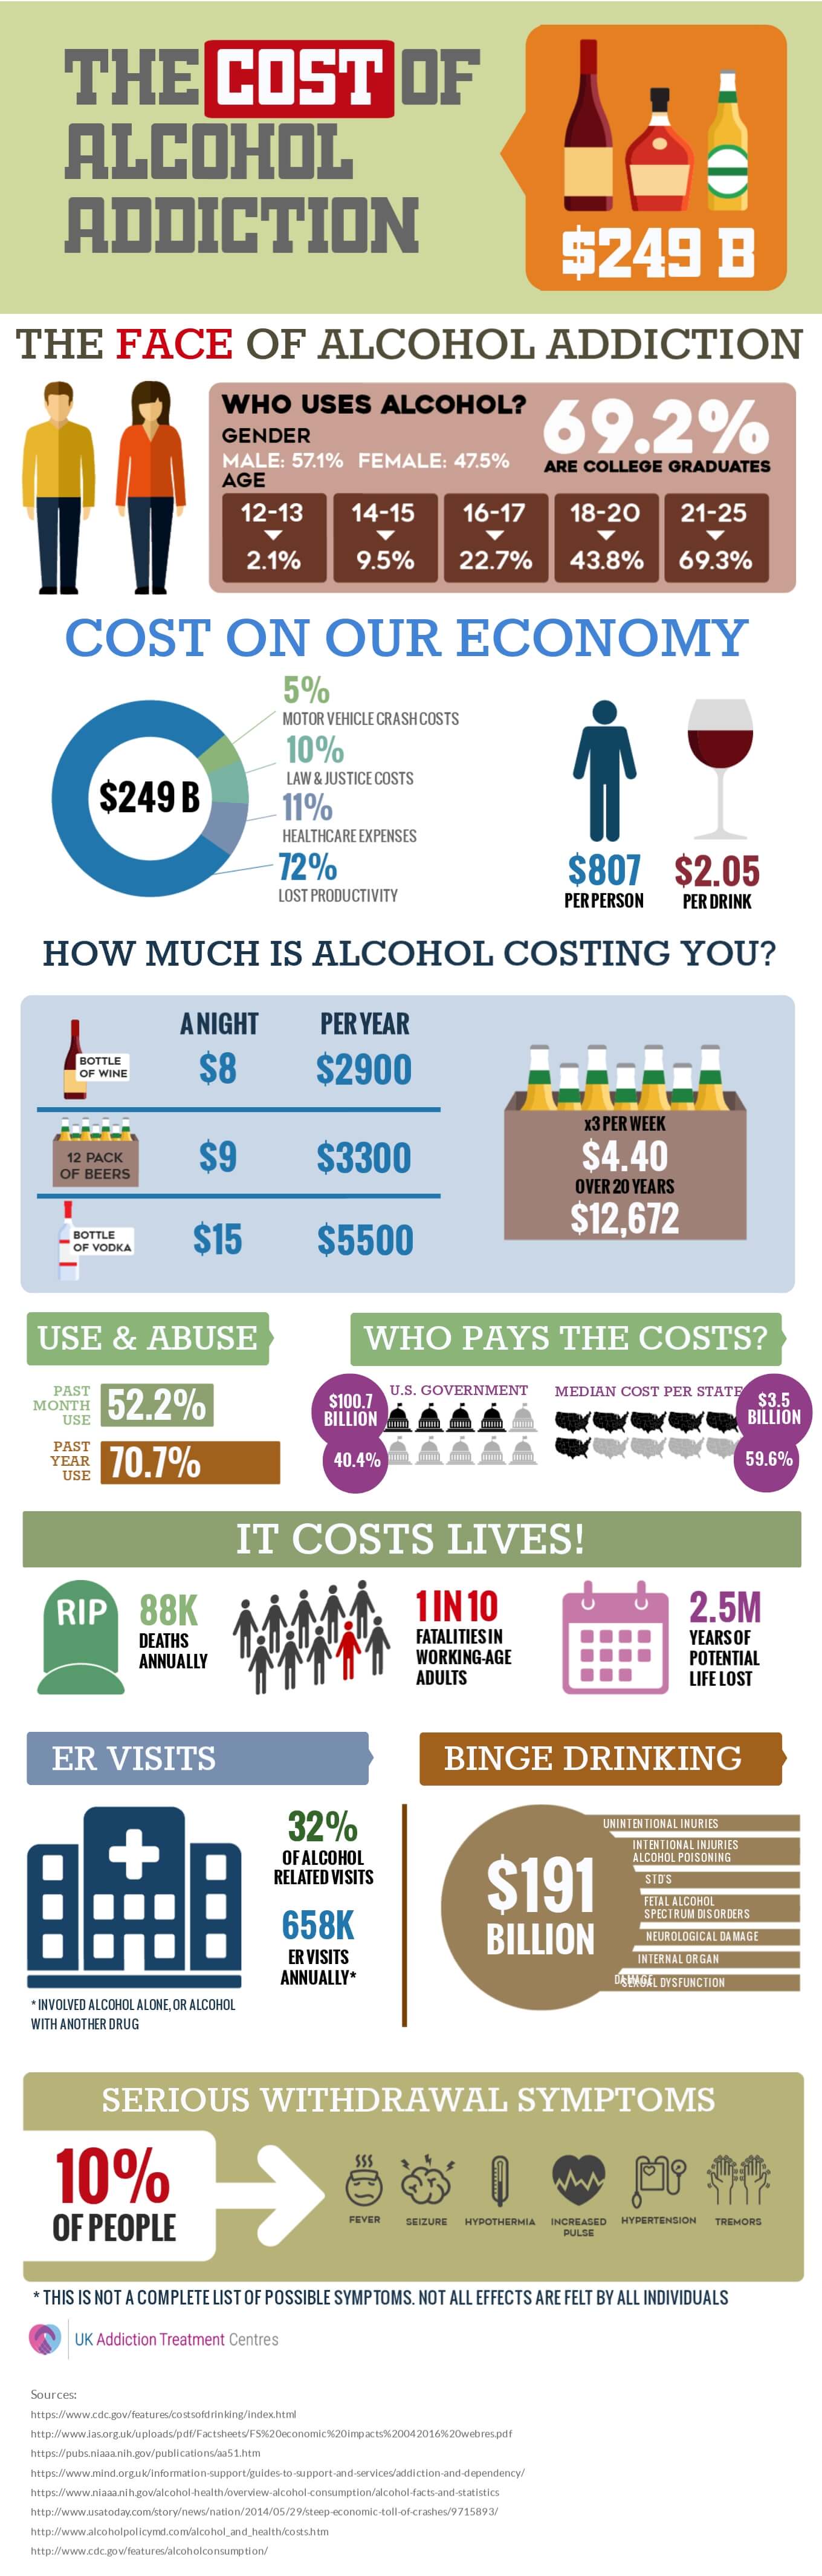
- Alcohol and drug abuse cost: $249 billion and $271 billion respectively
- Lost productivity due to alcohol: $174 billion
- Lost working days due to alcohol misuse: 56 million
Impact of Alcoholism and Drug Dependence in the Workplace
- Increased accident rate/injuries
- Absenteeism/extra sick leave
- Lowered productivity
- Fatal accidents/premature death
Men in blue collar jobs face 3.5 times the risk of dying from alcohol-related diseases than those in managerial positions. Women in routine jobs face 5.7 times the risk of dying from alcohol-related diseases than those in white-collar industries.
Fields with the Most Problem Drinkers (per 1000 workers)
- Construction and mining: 135
- Wholesale: 115
- Retail: 114
- Leisure and hospitality: 109
- Business, installation, maintenance, and repair: 106
Fields with the Highest Rates of Drug Abuse
- Food preparation and serving: 17.4%
- Construction: 15.1%
- Arts, design, entertainment, sports and media: 12.4%
- Sales: 9.6%
- Installation, maintenance, and repair: 9.5%
Workforce Drug Testing Index
2016 data shows the highest (24% increase) workforce drug positivity since 2004, driven by illicit drugs.
Increase in positivity in the general U.S workforce from 2013-2016:
- Oral fluid drug tests: 56.7% (with marijuana at a 74.7% increase – 5.1% in 2013 and 8.9% in 2016; methamphetamines at a 75% increase)
- Hair drug tests: 41.9%
- Urine drug test 2015-2016: cocaine at 12% increase; and 7.7% increase in the federally mandated, safety-sensitive US workforce.
Facts:
Performance-related problems linked to alcohol are caused by drinking before work, resulting in hangovers that increase the frequency of:
- Feeling sick/taking sick days
- Sleeping on the job
- Trouble with tasks/co-workers
Workplace drinkers are:
- Men more than women
- Younger more than older
- Single rather than married
- Managers more than their underlings
Other Statistics:
- In the past year, 24% of drinkers drank during their workday
- 80% of alcohol-related problems at work are from social drinkers, not alcohol -dependent people
- One in ten small business owners report that employees have shown up for work under the influence of controlled substances.
- Drug abuse costs businesses $81billion/year (up to 10% of annual payroll)
- 75% of illicit drug users are currently employed (17% of the workforce)
- 9 out of 10 drug abusers work at small or medium-sized businesses
- 60% of adults know someone who has gone to work under the influence
- 3 million workers go to work under the influence each year (3% of the workforce)
Employee hangovers:
- 83% of employees admit that their performance was affected
- 33% admit to having gone to work with a hangover
- 22% (nearly 1 in 4) admit to making mistakes at work